September 8th marked 1 year since we launched our iPhone web application. We’ve been meaning to add some new features for a while, and what better time to do that than on its first birthday? So we started adding some new features yesterday and just launched them tonight. It’s still not meant as a full replacement for the desktop version, but these new features really add to the experience and make it that much more enjoyable to check your analytics on the go:
Visitor segmentation
You can now analyze any segment of visitors like you can in the desktop version. Just click on any item when viewing popular data, and you will see data about that specific segment of visitors:


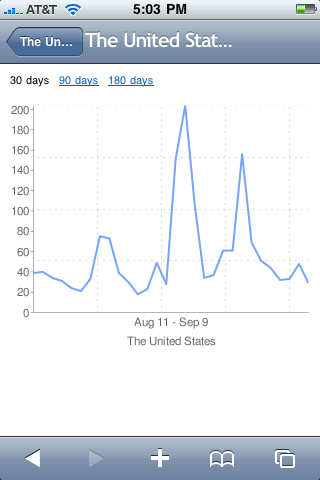
Historical data / graphs
You can now view the historical data for any individual item. Just click the red/green percentage next to any item, and you will see its daily history. We’re using the pretty amazing Google Charts API to generate these graphs, since Flash doesn’t work on the iPhone.


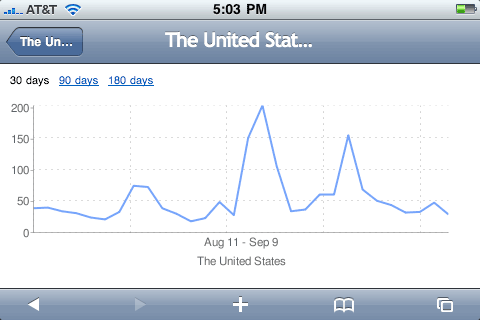
You can view history in landscape mode as well, which will widen the graph to see better detail:

Organized dashboard
We’ve organized all of the menu options on the dashboard into groups, which makes it much quicker to find what you’re looking for. As you can see here, we also added the new Short URLs data (from clicky.me) to the iPhone app:

More dates
You can now select dates going back as far as 6 months, including individual months:

Lastly, we wanted to let you know that the entire crew at Clicky (yeah, all 2 of us) will be at the TechCrunch 50 conference in San Francisco this coming Monday and Tuesday, so if you’re going to be there, we’d love to meet up. Also, because of our traveling schedule (we’ll actually be in San Fran for 5 days), please be patient if you send us an email. We’ll of course still be checking them on a daily basis but unless it’s an emergency, it may take a few days before we respond. Thanks for understanding. We look forward to seeing you there 🙂

