Part of our massive preferences overhaul included chipping away some nasty cruft. One of those things was the option to allow simple HTML bar graphs to be the default graphing method. This was used by very few people so we removed it as an option to be the default graphing option.
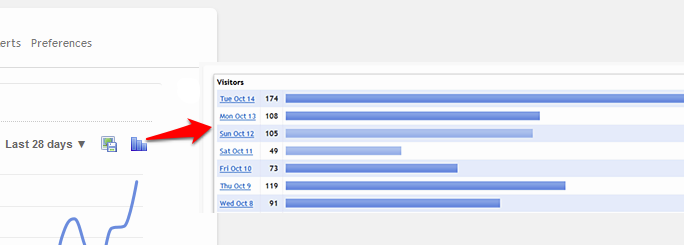
But have no fear, we know this method is still useful even for people who never set it as their default, so we changed it to be an on-demand option that you can see in the top right corner of every graph. Whatever date range you’re viewing in a graph, clicking the bar graph will show the same data, with one exception: no hourly data. Bar graphs never supported hourly data since they were created (and deprecated) well before we added support for hourly data. So they still don’t do that. When viewing hourly data, if you view a bar graph it will just show the last 28 days instead.
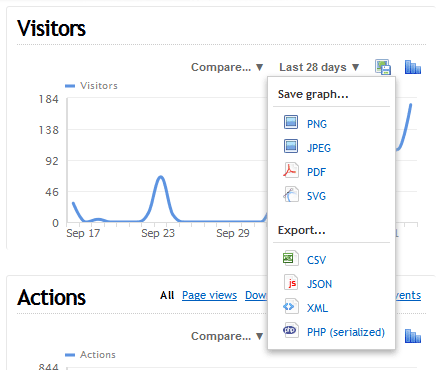
We’ve also added the ability to export the raw data you see in any graph straight from the API, straight to CSV or the other formats our exporting of normal (non-graph) reports has always supported. Unlike bar graphs, this method does support hourly data, so that’s good. It will honor whatever date range you are viewing in the graph.
The new-ish ‘Download’ menu we added for graphs has been changed to an icon indicating you can “save the graph”, in there are the old options to save it in various image formats, and new options below to export the raw data itself.
Also released today were a few new features that have been requested fairly often: A site preference to allow the logging of all bot activity, and a user preference for hiding the current hour in hourly graphs, to avoid panic when seeing a ‘cliff’ near the beginning of the hour.
These are covered in more detail in this post, so be sure to check those out too and let us know what you think!